3. Regression model#
[1]:
import numpy as np
import matplotlib.pyplot as plt

from relife import ProportionalHazard, AgeReplacementPolicy, Weibull, Gompertz
from relife.datasets import load_insulator_string
[2]:
cp = 1
cf = 5
discounting_rate = 0.05

time, event, entry, *covar = load_insulator_string()
print(time)
print(covar)
covar = np.column_stack(covar)
[70.  30.  45.  ...  8.8  7.6 53. ]
[array([0.49, 0.76, 0.43, ..., 1.12, 1.19, 0.35]), array([1.69, 1.79, 1.61, ..., 1.76, 1.74, 1.61]), array([0.24, 0.39, 0.25, ..., 0.21, 0.24, 0.28])]
[3]:
distrib = Weibull(5, 0.03)
[4]:
ProportionalHazard(distrib, (1, 2, 3)).hf(2, np.random.random((10, 3)))
[4]:
array([[1.35015800e-04],
       [4.46619853e-05],
       [7.66567248e-05],
       [2.21184576e-05],
       [3.94273044e-05],
       [2.00097602e-05],
       [1.10502796e-04],
       [1.40035168e-04],
       [1.78755533e-05],
       [4.94135165e-05]])
[5]:
ph = ProportionalHazard(Gompertz()).fit(time, event, entry, model_args=(covar,))
[6]:
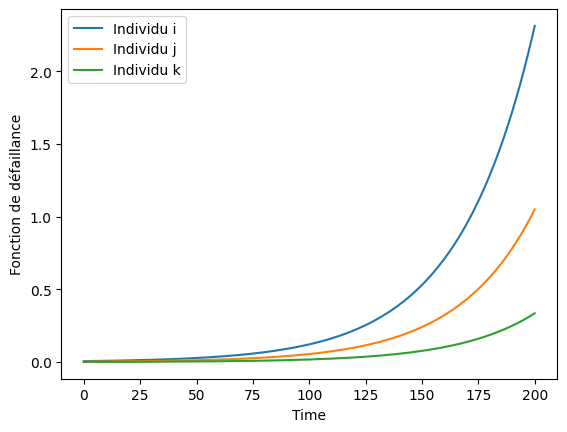
# plot hazard function for some individuals
i, j, k = 12, 1073, 7999
t = np.linspace(0, 200, num=1000)
plt.plot(t, ph.hf(t, covar)[i], label="Individu i")
plt.plot(t, ph.hf(t, covar)[j], label="Individu j")
plt.plot(t, ph.hf(t, covar)[k], label="Individu k")
plt.xlabel("Time")
plt.ylabel("Fonction de défaillance")
plt.legend()
plt.show()
[7]:
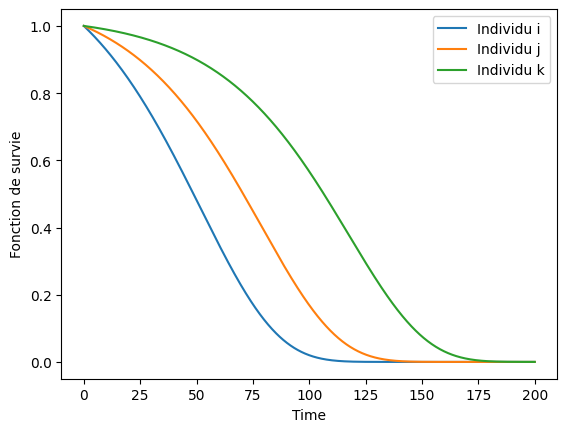
# plot survival functions of some individuals
plt.plot(t, ph.sf(t, covar)[i], label="Individu i")
plt.plot(t, ph.sf(t, covar)[j], label="Individu j")
plt.plot(t, ph.sf(t, covar)[k], label="Individu k")
plt.xlabel("Time")
plt.ylabel("Fonction de survie")
plt.legend()
plt.show()
3.1. Politique de remplacement par âge dans un modèle à covariables#
Il est possible de fitter une politique de remplacement par âge d’après un modèle proportionnel. Il suffit de passer les covariables dans l’argument model_args de la classe AgeReplacementPolicy.
[8]:
# Calculons la politique et l'âge de remplacement pour les individus i, j, k définis ci-dessus:
policy_ph = AgeReplacementPolicy(
    ph, cf, cp, discounting_rate=discounting_rate, model_args=(covar[[i, j, k]],), nb_assets=3
)
policy_ph.fit(inplace=True)
print(policy_ph.ar)
[[47.46195742]
 [64.14739936]
 [94.26745407]]